Gallery
Animated absorbance spectrum of vanadium electrolyte during oxidation from V²⁺ to V⁵⁺, the color band represents the visual appearance of the vanadium electrolytes (UC3M, Madrid)

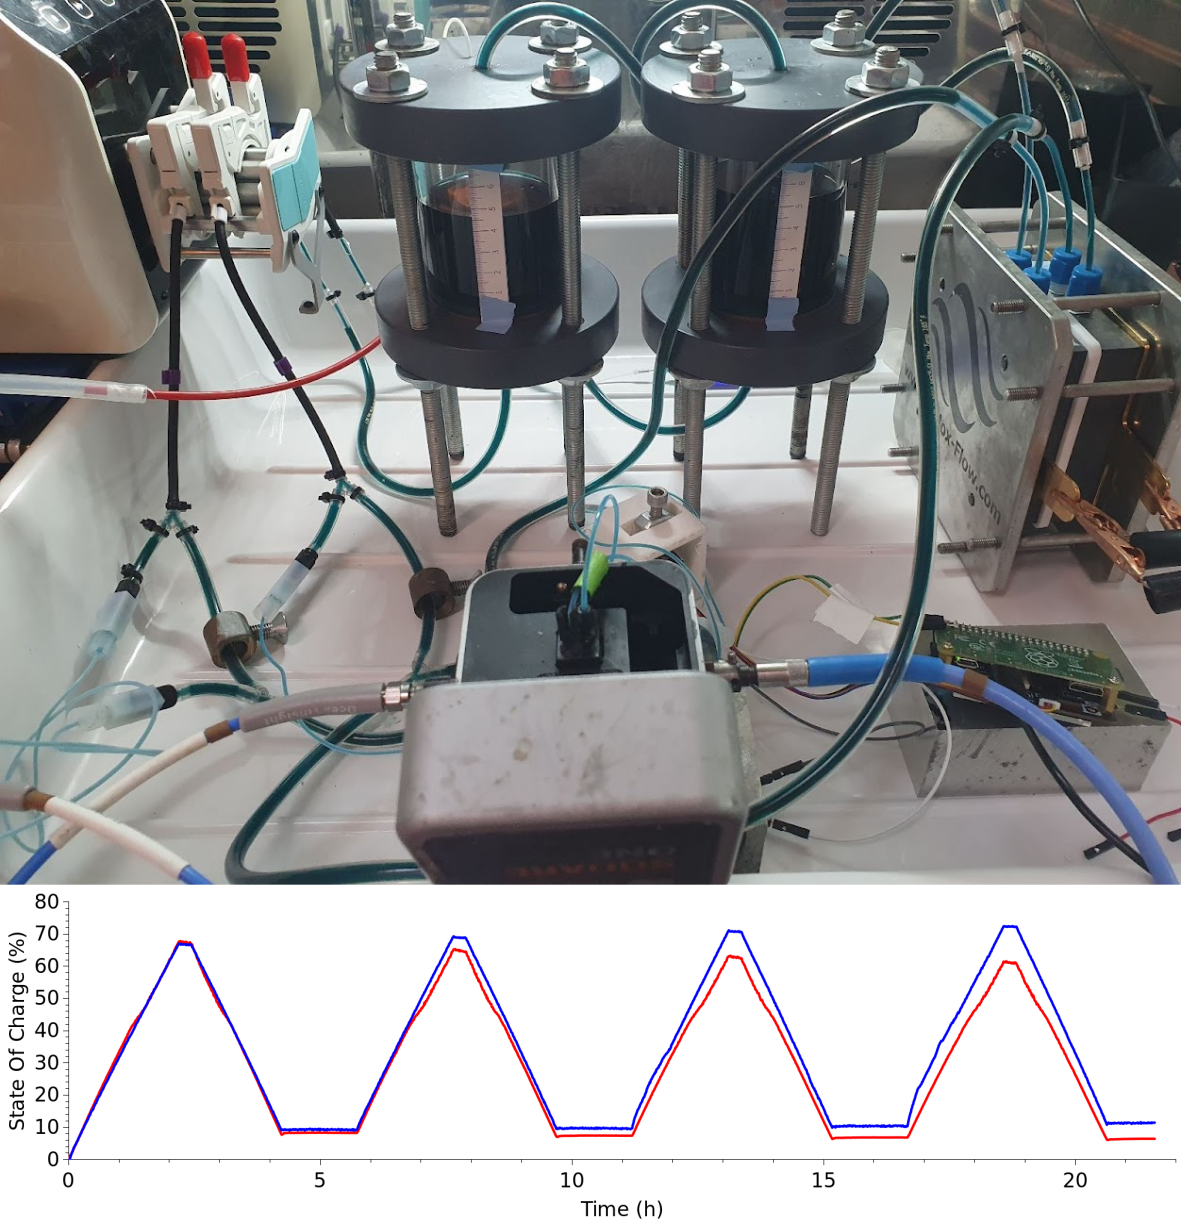
The Vanadium Flow Battery, paired with online UV-Visible measurements. The graph below shows the accumulation of electrolyte imbalance during cycling where both the positive (red) and the negative (blue) State of Charge diverge (UC3M, Madrid)
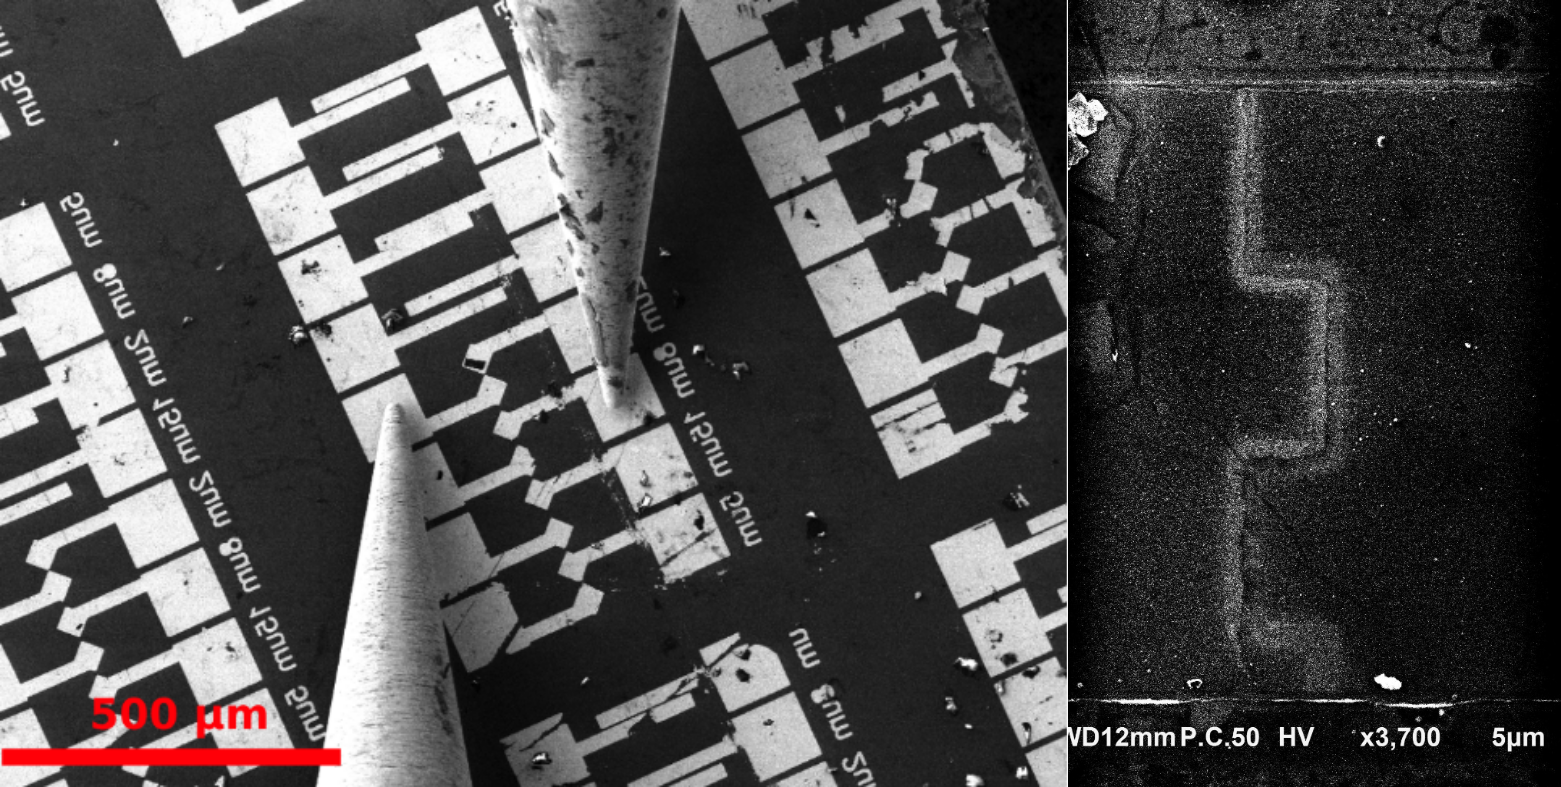
SEM images of graphene transistors under electrical probing, showing a detailed view of the nanogap, which propagates into a precise crenelated pattern (LIMMS, Lille, NTU, Singapore)
electronic components, mobile phone and naked boards and their respective X-Ray absorbance images, CEA-LETI (Grenoble) 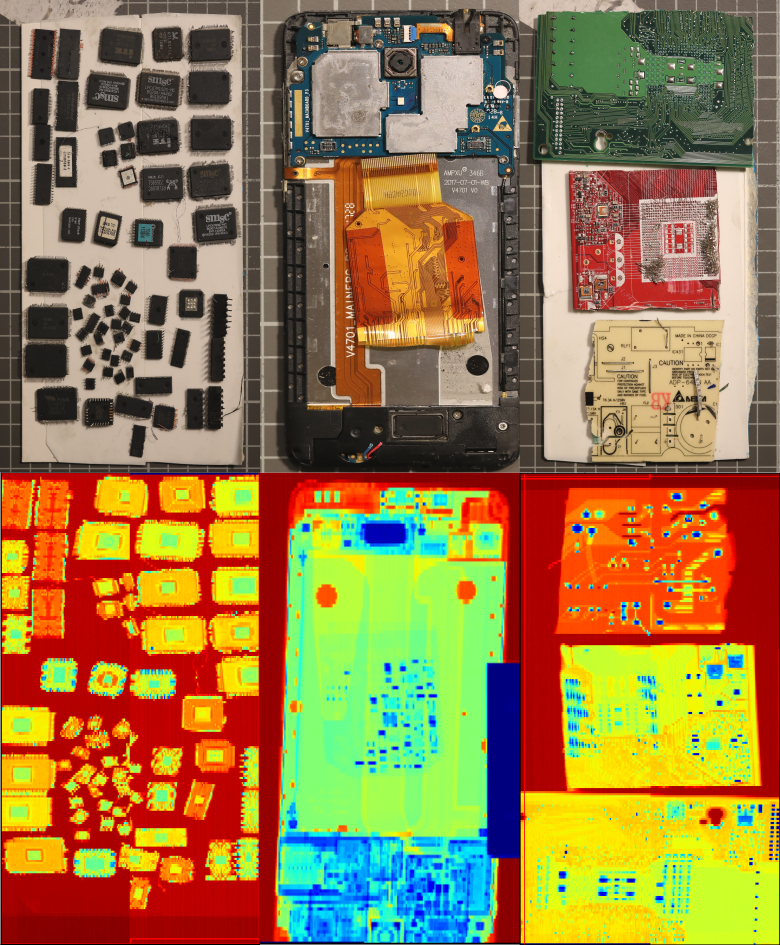
Video showing the operation of a small scale bowl feeder, thanks to the vibrations, the components climb up the bowl to be fed one by one (NTU, Singapore)